At a glance see what crops and how much are currently planted on your farm.
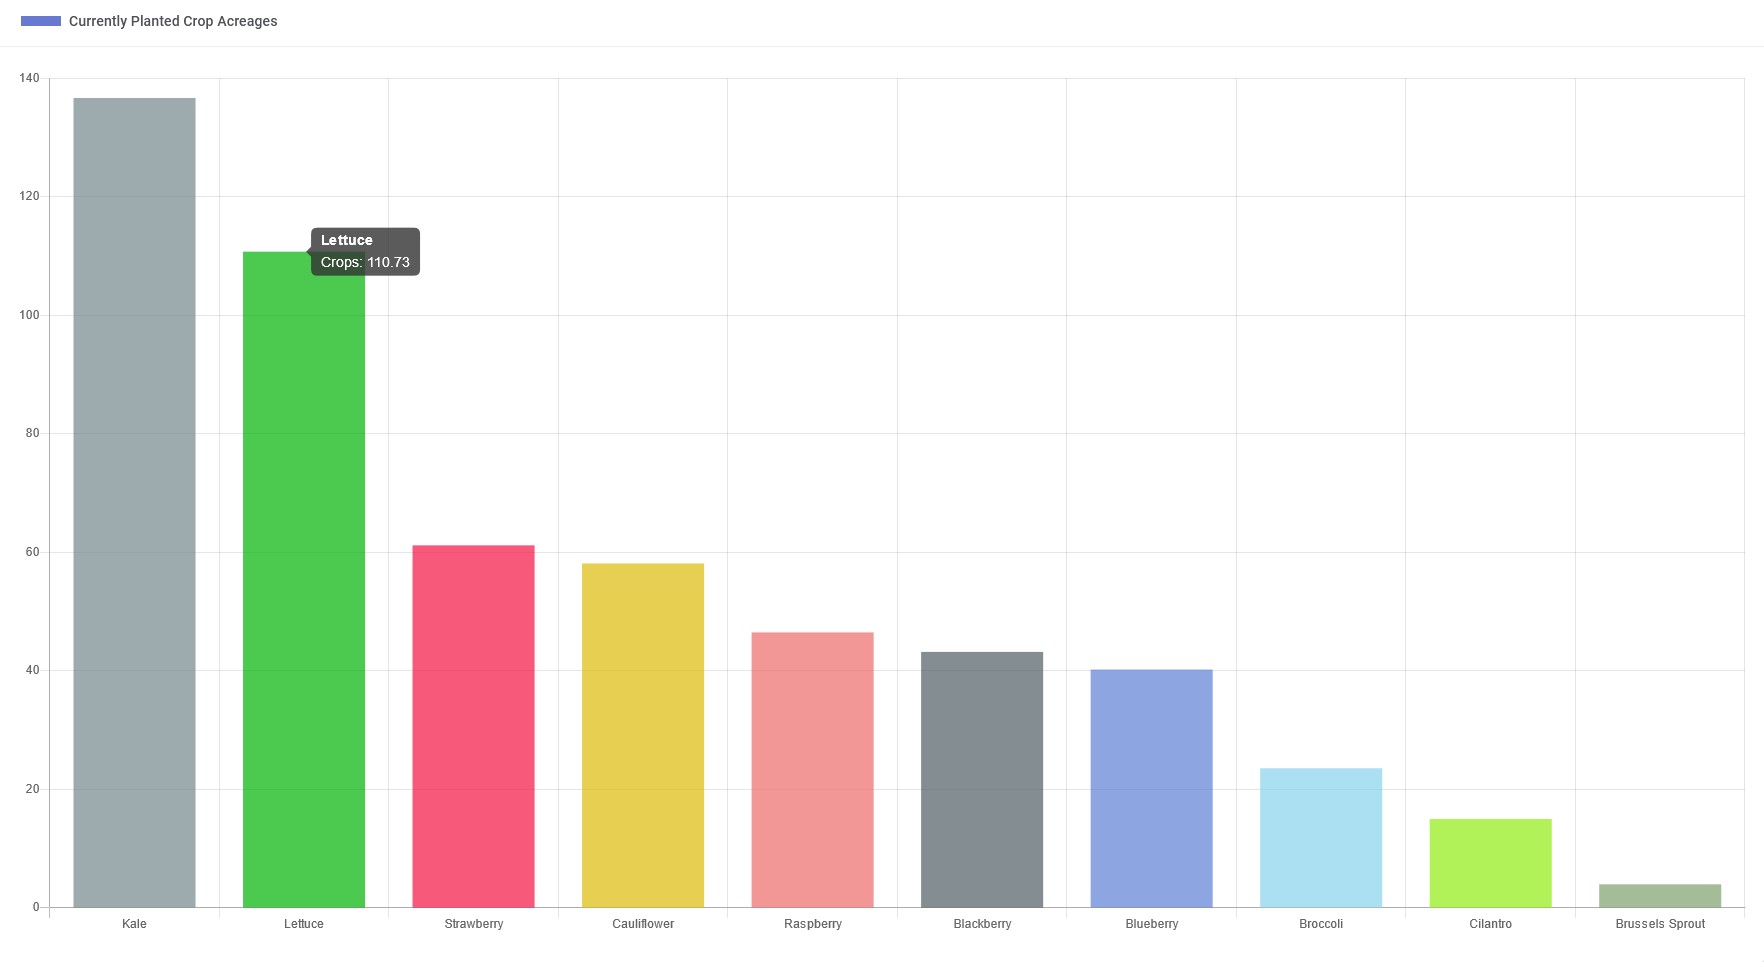
This chart shows you how many acres of each Row and Permanent crops are currently planted on your farm. Again, it is worth noting that this chart displays only acreages for currently planted crops, not Previous or Next planned crops.
For better visualization, this chart orders crops with the most acreage on the left-side of the chart. This order makes it easy to quickly see which crops have the most acreages.
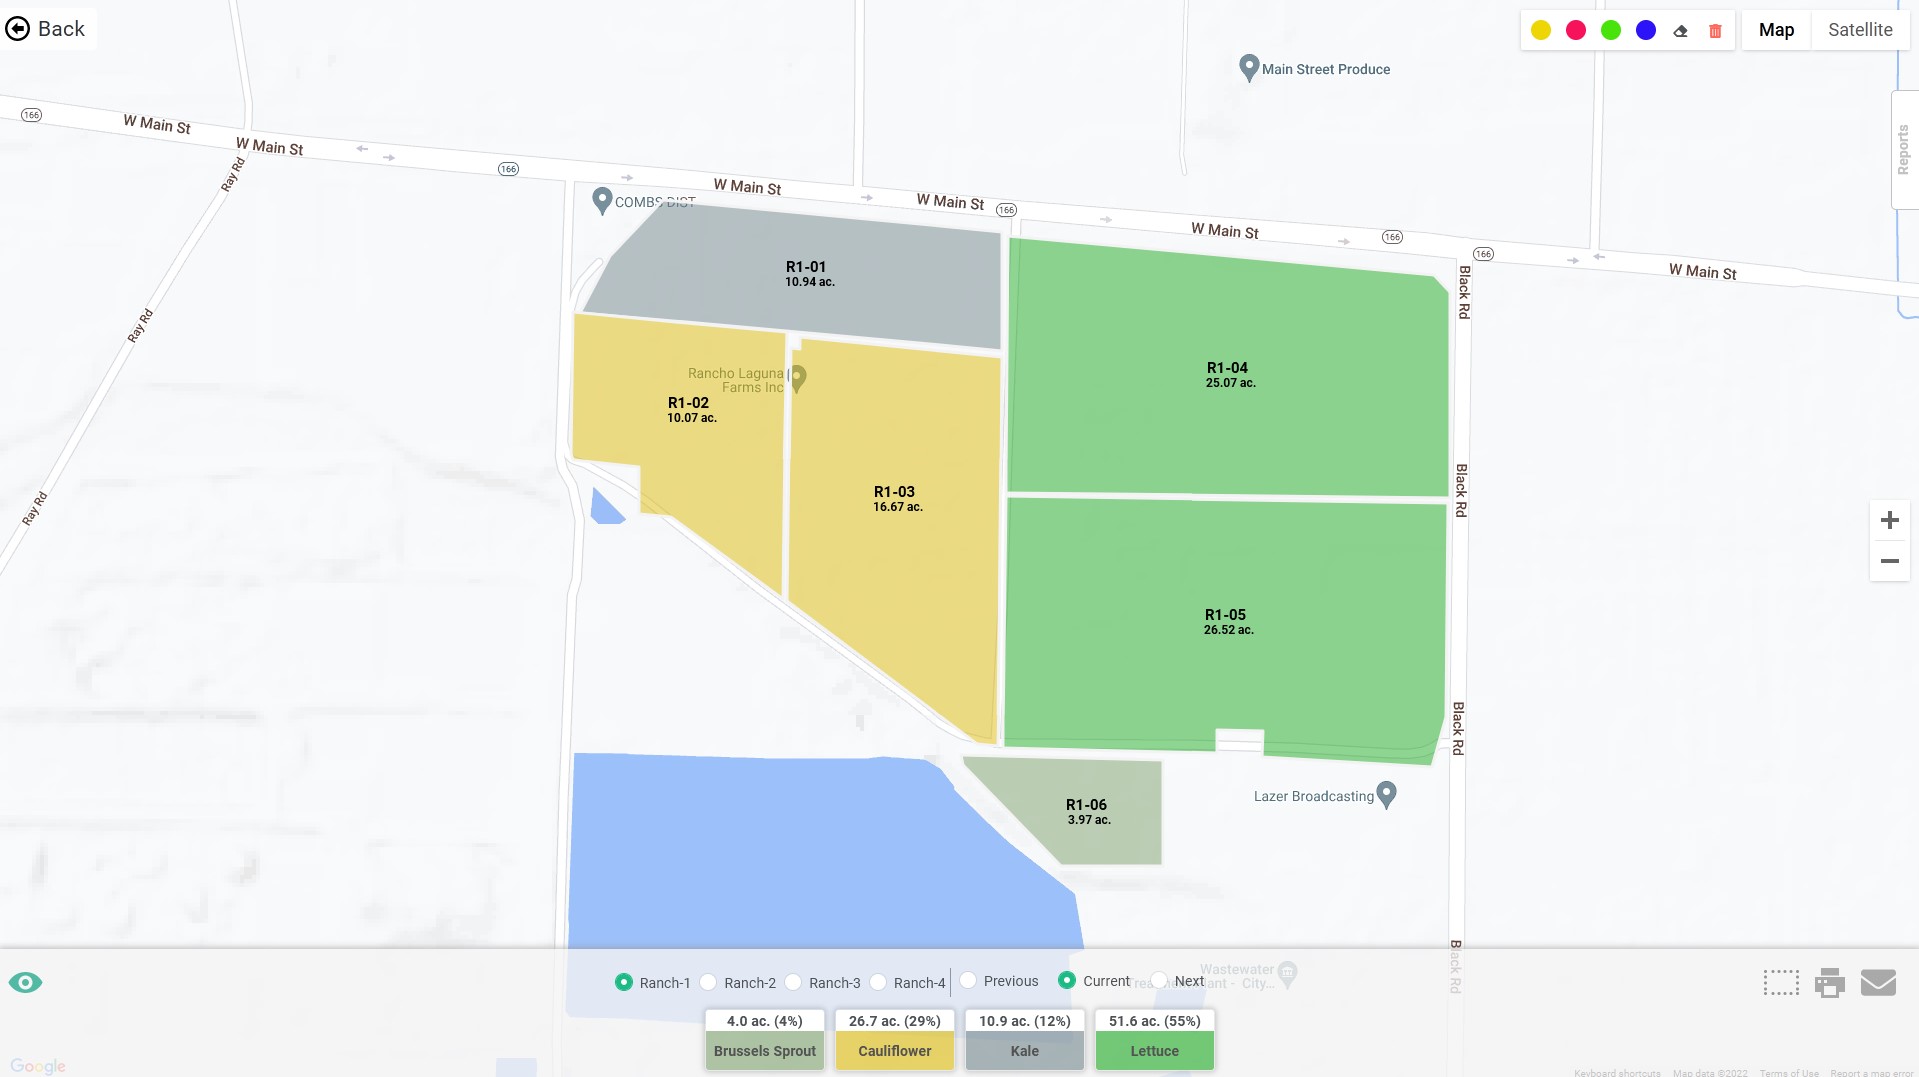
You can easily customize / change the color for each crop in your account’s Management area. The color you choose for each crop will also show up on the map. Check out an example of map’s screenshot below.
If you would like to analyze your field and crop data in more detail, just download one of the planting reports. For example, you can download Quarterly Plantings & Harvests which will show you crop information for each field.
Monitor currently planted crop acreages with AgNote
AgNote farm management software is a valuable tool for farmers, offering a comprehensive suite of features to efficiently monitor crop acreages. Its user-friendly interface simplifies the tracking of planted crops, while providing powerful tools for planning and comparing planting strategies. With AgNote, farmers gain visibility into every aspect of their crop management, from irrigation to harvest, ensuring informed decision-making for higher productivity and sustainability.
Discover the future of farming with AgNote! Sign up today for a free seven-day trial and experience how our platform can simplify your farm management. No credit card required, just a passion for agriculture and the desire to grow smarter. Join the AgNote community now and take the first step towards a more efficient and productive farm. Let’s cultivate success together!